Currency Rates & Crypto Prices
Currency Rates & Crypto Prices
Section titled “Currency Rates & Crypto Prices”Accurate pricing is the foundation of fair market value calculations, gain/loss computation, and financial reporting. CryptaCount maintains both fiat exchange rates and crypto asset prices, with automated syncing and health monitoring.
Currency Rates
Section titled “Currency Rates”View fiat exchange rates under Currency Rates in the sidebar.
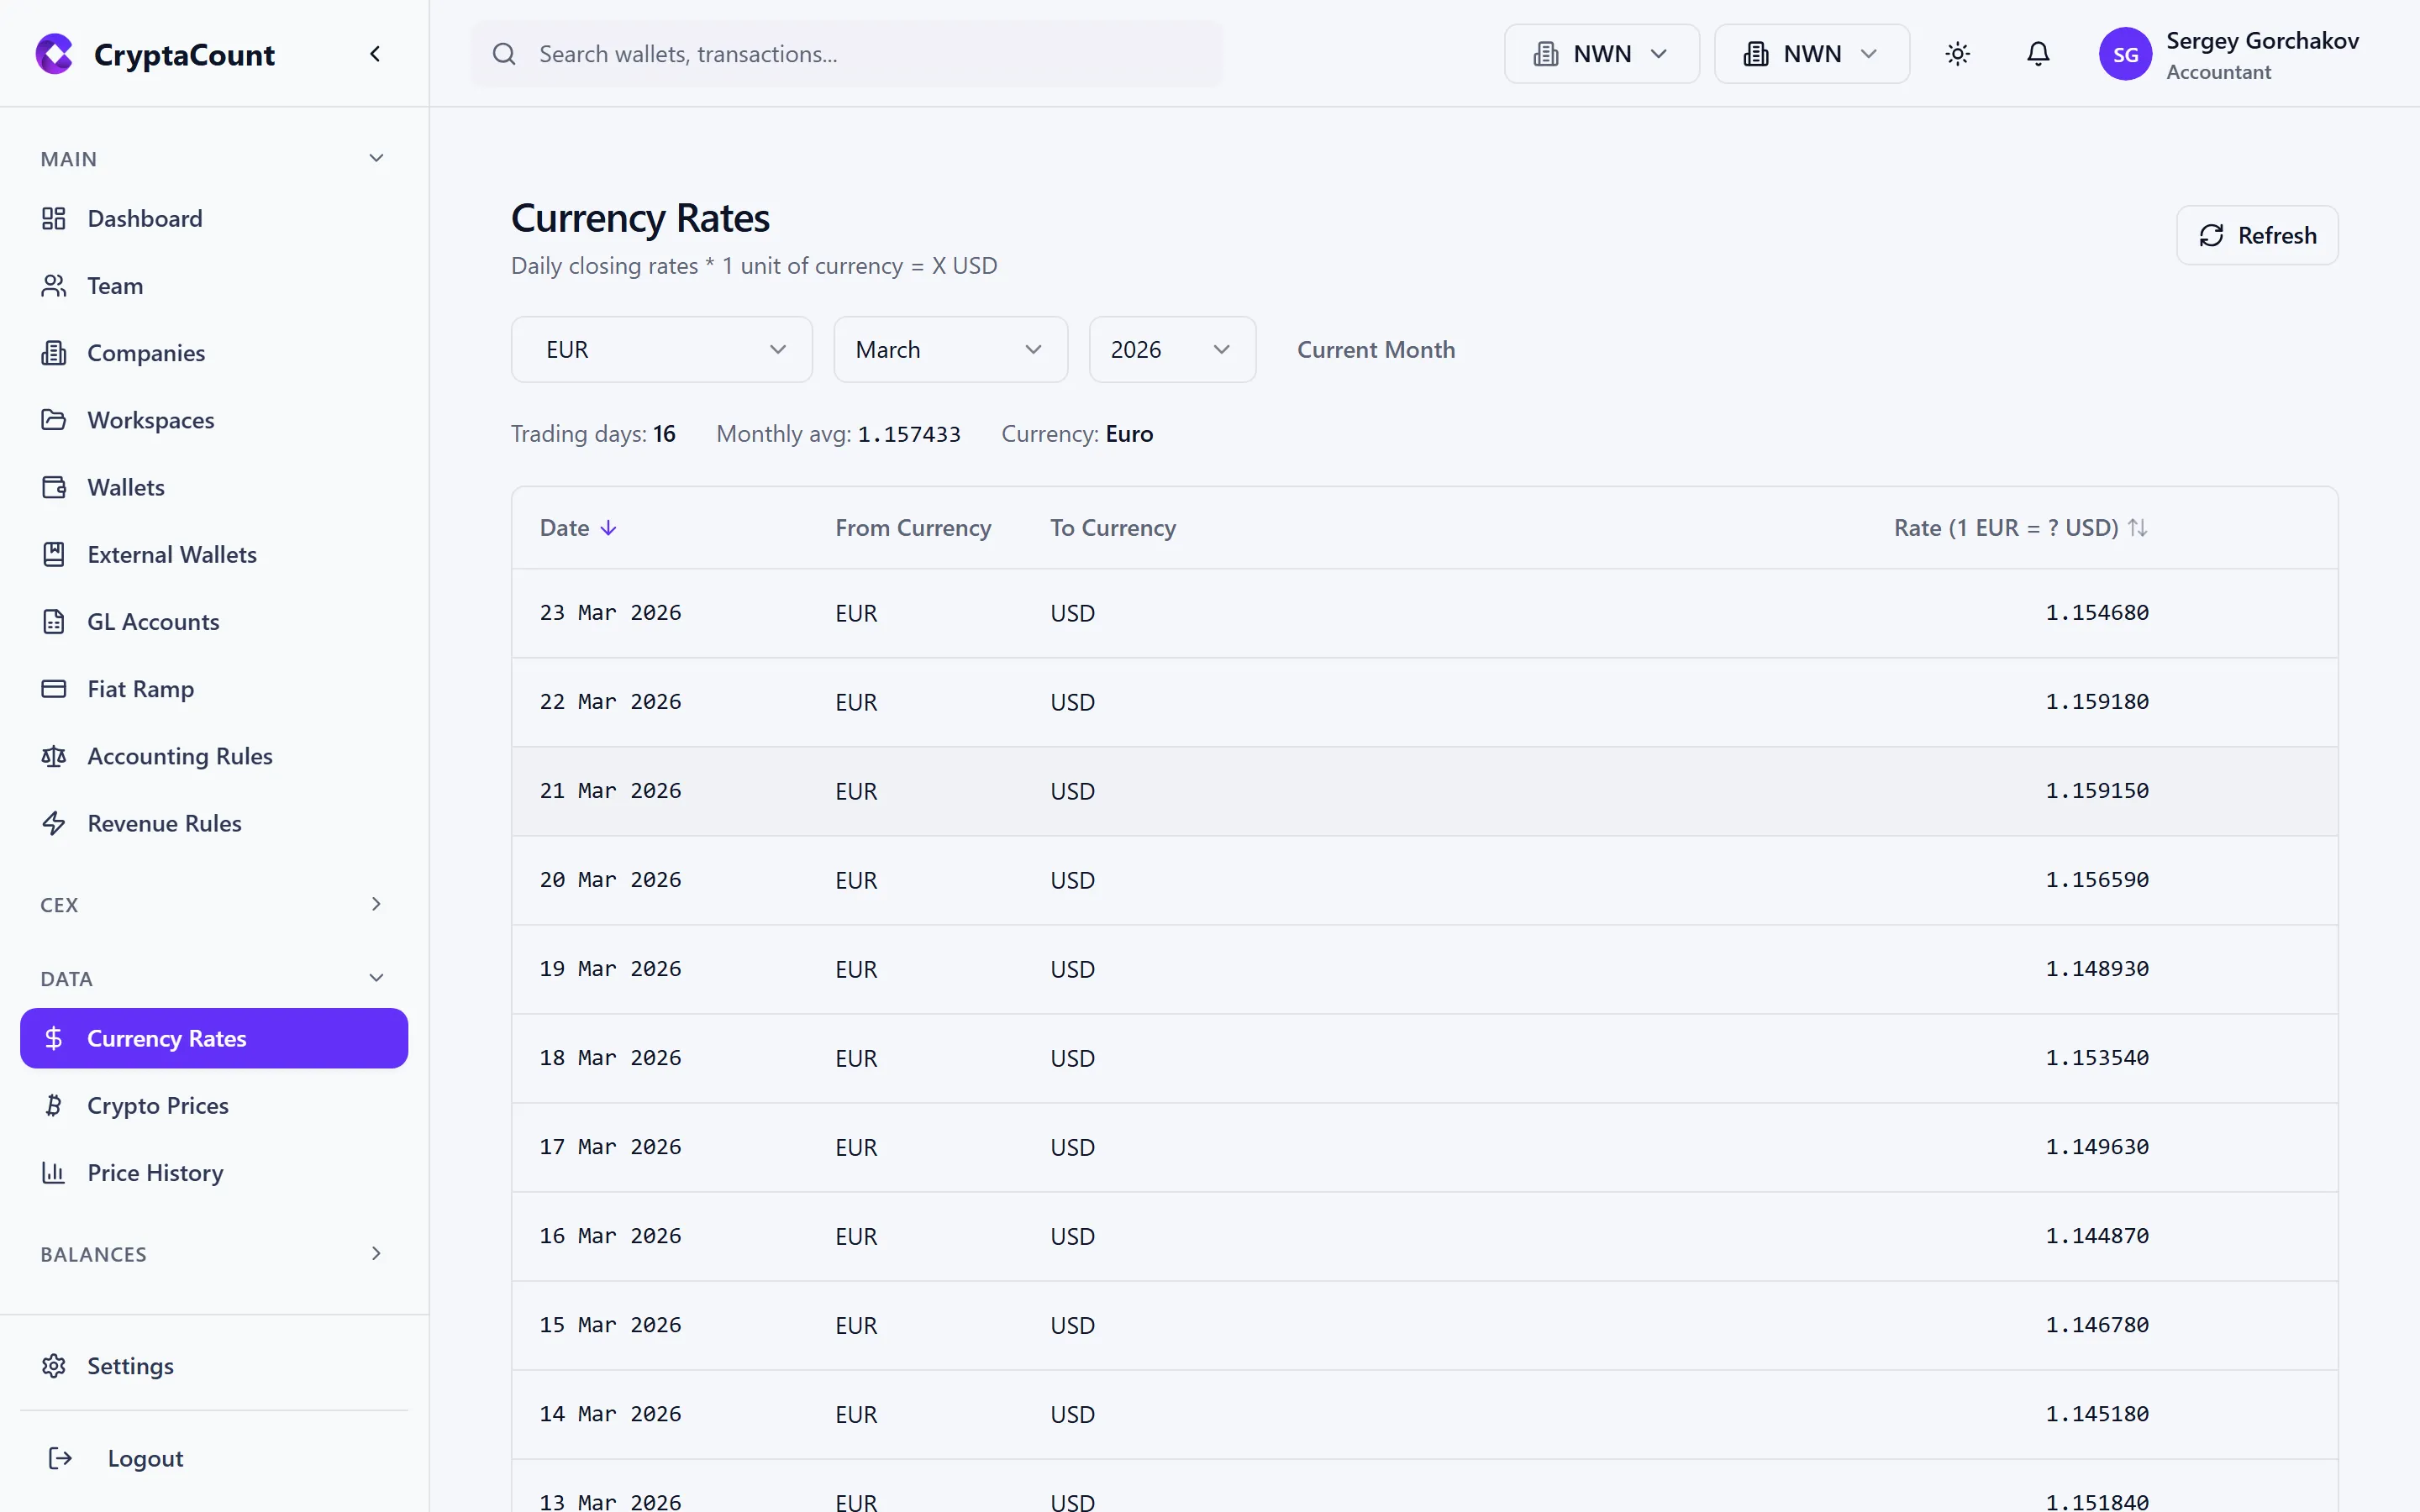
CryptaCount syncs fiat exchange rates from central bank and market data sources. These rates are used whenever the system converts between currencies — for example, when Acme Digital Holdings reports in EUR but an asset’s primary market trades in USD.
What’s Displayed
Section titled “What’s Displayed”- Currency pair — Base / quote (e.g., USD/EUR, GBP/USD)
- Current rate — Latest available rate
- Date — Effective date of the rate
- Source — Data provider for this rate
Rate Types
Section titled “Rate Types”- Daily rates — End-of-day rates used for balance calculations and period-end reporting
- Monthly averages — Average rate over a calendar month, used for income statement conversion in some jurisdictions
- Historical rates — Rates for any past date, used for historical cost calculations
Syncing Rates
Section titled “Syncing Rates”Fiat exchange rates sync automatically:
- Scheduled sync — Runs at 6 PM UTC, Monday through Friday
- Manual sync — Trigger a sync from the currency rates interface for immediate updates
- Backfill — Request rates for specific date ranges if historical data is missing
Pegged Currencies
Section titled “Pegged Currencies”CryptaCount tracks pegged currency relationships (e.g., stablecoins pegged to USD). Pegged currencies are listed with their target currency, and the system uses the peg relationship when the specific stablecoin price is unavailable.
Crypto Prices
Section titled “Crypto Prices”View current crypto asset prices under Crypto Prices in the sidebar.
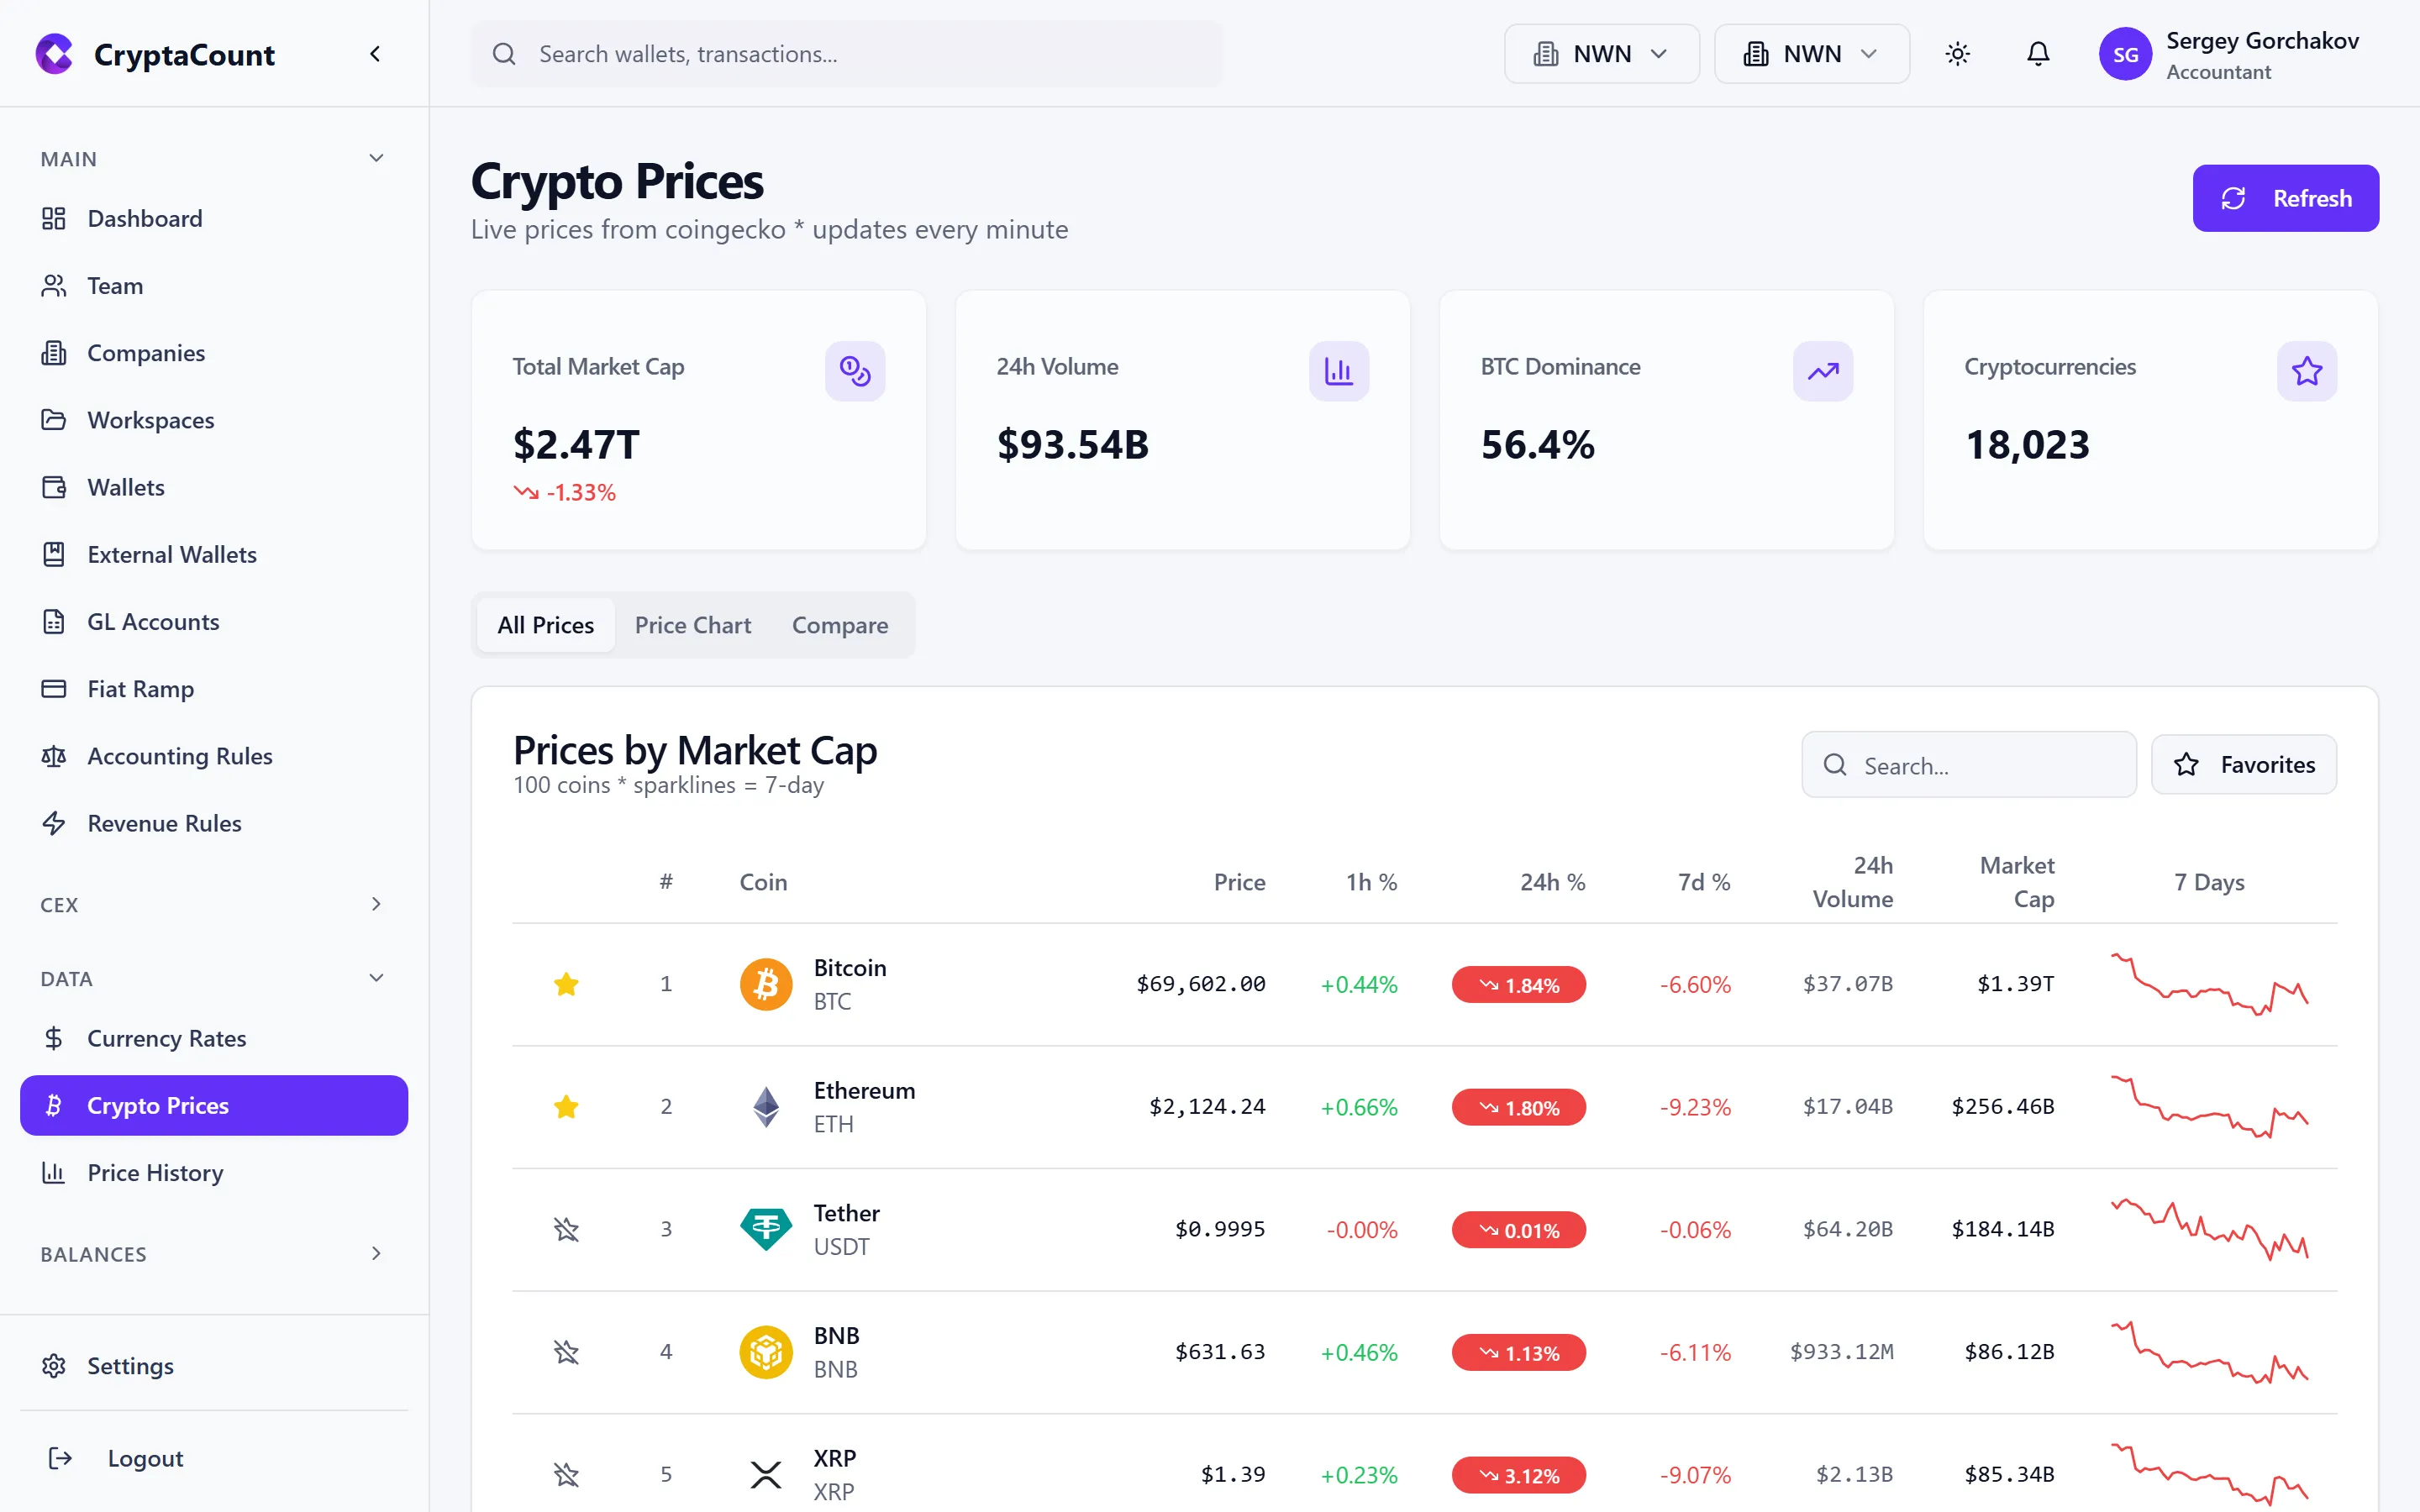
Market Overview
Section titled “Market Overview”The prices page shows:
- Asset — Token symbol and name
- Current price — Latest price in your base currency
- 24h change — Price movement over the last 24 hours
- Market cap — Total market capitalization (where available)
- Source — Which pricing feed provided this data
Search and Filter
Section titled “Search and Filter”- Search — Find specific assets by symbol or name
- Trending — View currently trending assets by volume
- Coverage — Check which assets in your workspace have price data available
Price Syncing
Section titled “Price Syncing”Crypto prices sync automatically:
- Daily sync — Runs at 00:05 UTC to capture end-of-day prices
- Live prices — Current spot prices available on demand for supported assets
- Missing prices — The system tracks which assets and dates lack price data
Price Sources and Priority
Section titled “Price Sources and Priority”CryptaCount aggregates prices from multiple sources with fallback logic:
- Primary market data providers — High-reliability feeds for major assets
- Secondary providers — Broader coverage for long-tail tokens
- DEX-derived prices — On-chain pricing for DeFi tokens without centralized exchange listings
- Manual entry — User-provided prices for assets with no automated source
Crypto Price History
Section titled “Crypto Price History”View historical price data and charts under Crypto Price History in the sidebar.
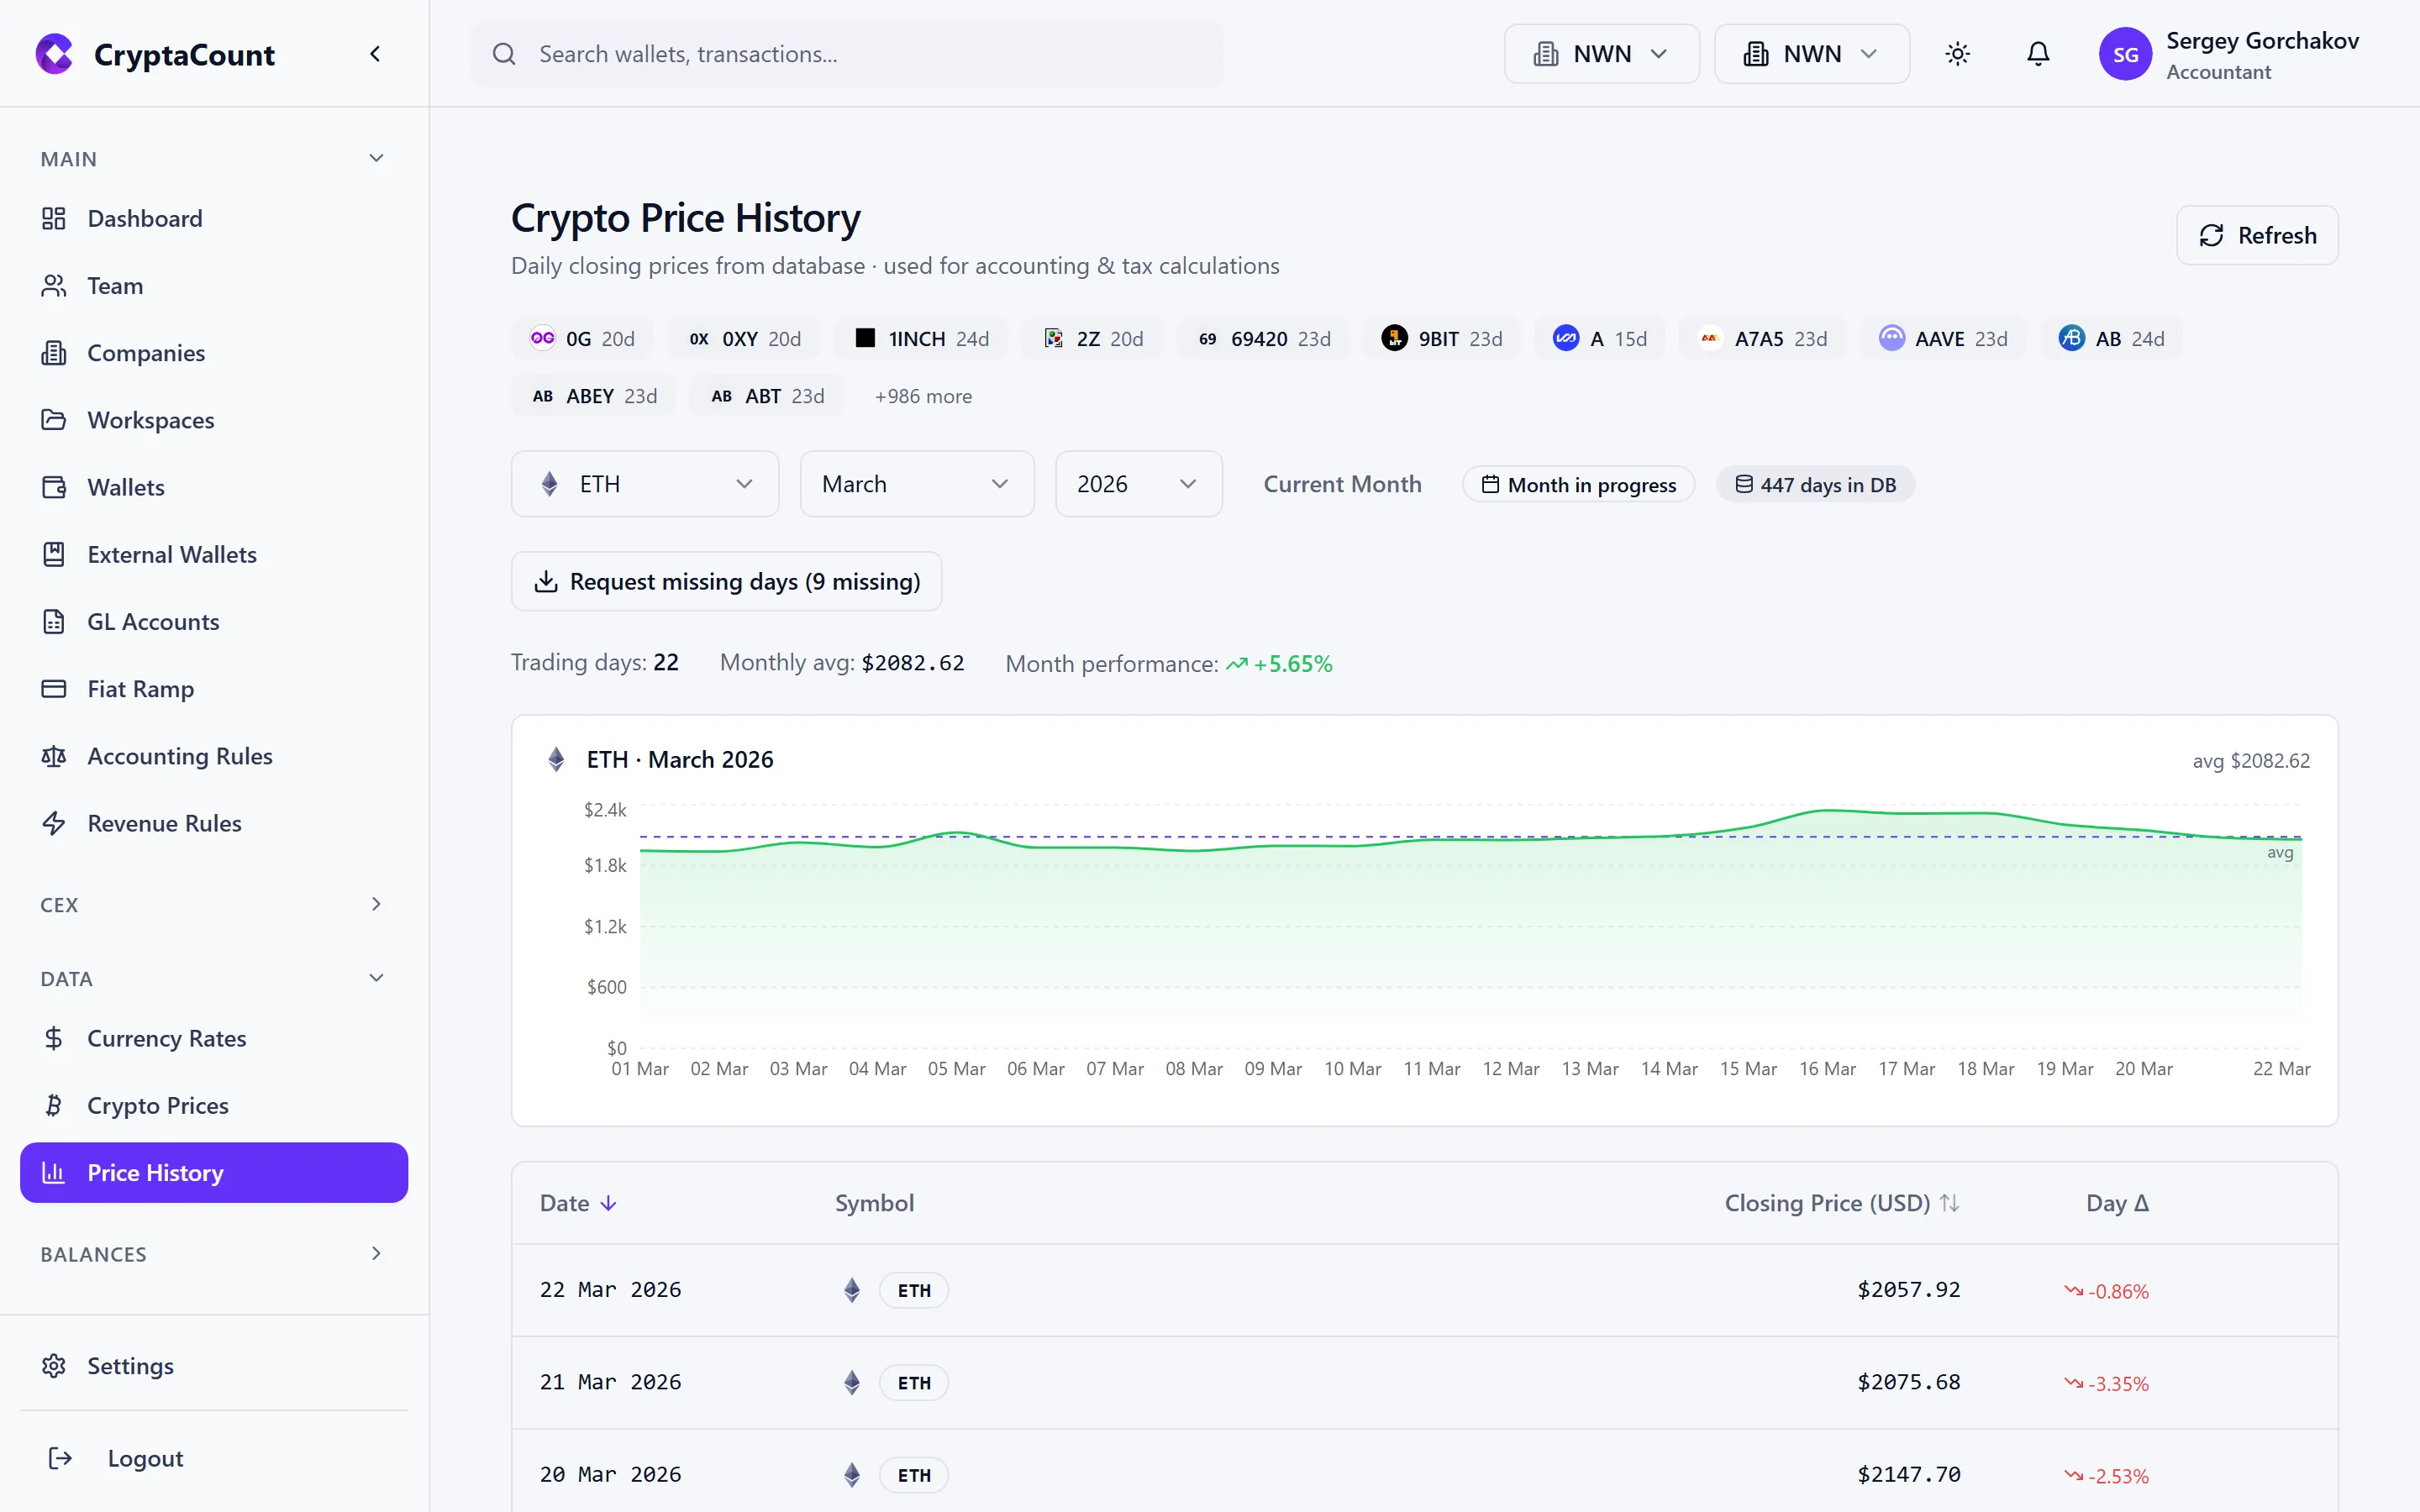
Price Charts
Section titled “Price Charts”Select an asset to view its price history:
- Time range — View data for the last week, month, quarter, year, or a custom range
- Granularity — Daily prices (default) with the option to view monthly aggregates
- Currency — Display prices in your base currency or USD
Historical Data Uses
Section titled “Historical Data Uses”Historical prices feed into several critical calculations:
| Calculation | How Prices Are Used |
|---|---|
| Fair Market Value | FMV at transaction date determines cost basis for acquisitions |
| Realized Gain/Loss | Disposal price minus cost basis lot price |
| Unrealized Gain/Loss | Current price minus cost basis for open positions |
| Impairment Testing | Comparing carrying value against market value |
| Balance Calculations | End-of-period prices for balance sheet reporting |
Price Coverage
Section titled “Price Coverage”The price history view also serves as a diagnostic tool. Check coverage for your workspace’s assets:
- Covered — Price data exists for all required dates
- Gaps — Specific dates or ranges where prices are missing
- No data — Assets with no price data at all
For assets with gaps, you can request a backfill or manually provide prices.
Price Health Monitoring
Section titled “Price Health Monitoring”Price health monitoring (available on qualifying plans) provides a deeper view into the reliability and completeness of price data.
Health Status
Section titled “Health Status”- Alerts — Assets where price data is stale, missing, or shows anomalies (e.g., sudden large spikes that may indicate bad data)
- Audit trail — History of price data changes, corrections, and backfills
- Coverage stats — Percentage of workspace assets with complete price coverage
Handling Missing Prices
Section titled “Handling Missing Prices”When prices are missing for transactions or balance dates:
- Check the reconciliation — The Price Availability check flags all instances
- Request backfill — For supported assets, trigger a historical price fetch
- Manual entry — For unsupported assets, enter prices manually
- Use proxy prices — For pegged or wrapped assets, the system can derive prices from the underlying asset